
Hypothesis scorecard
| # | Hypothesis | Predicted | Observed | Verdict |
|---|---|---|---|---|
| H1 | Dual-scaling species-area relationship (slope ratio > 1.10) | slope ratio ≈ 1.1–1.4 | 1.28 | CONFIRMED |
| H2 | Taste-tribe retention enrichment ≥ 1.5× over degree-preserving null | ≥ 5 clusters | 8/8 clusters 0.64–0.91× (below null) | REFUTED |
| H0 | Pure-neutral theory (log-series SAD with no deviation) | ΔAIC ≥ 10 favoring log-series | ΔAIC = 1.35 × 10⁶ favoring log-series | CONFIRMED |
Species-abundance distribution — H0 confirmed
| Model | Parameters | log L | AIC | ΔAIC |
|---|---|---|---|---|
| Log-series | α = 516.0 | 548,711 | −1,097,419 | 0 |
| Zero-sum multinomial | θ̂ ≈ 1.2 × 10⁶ | (χ²) | ≈ −1,097,317 | +102 |
| Truncated power law | α = 2.90 | −128,248 | +256,500 | +1,353,919 |
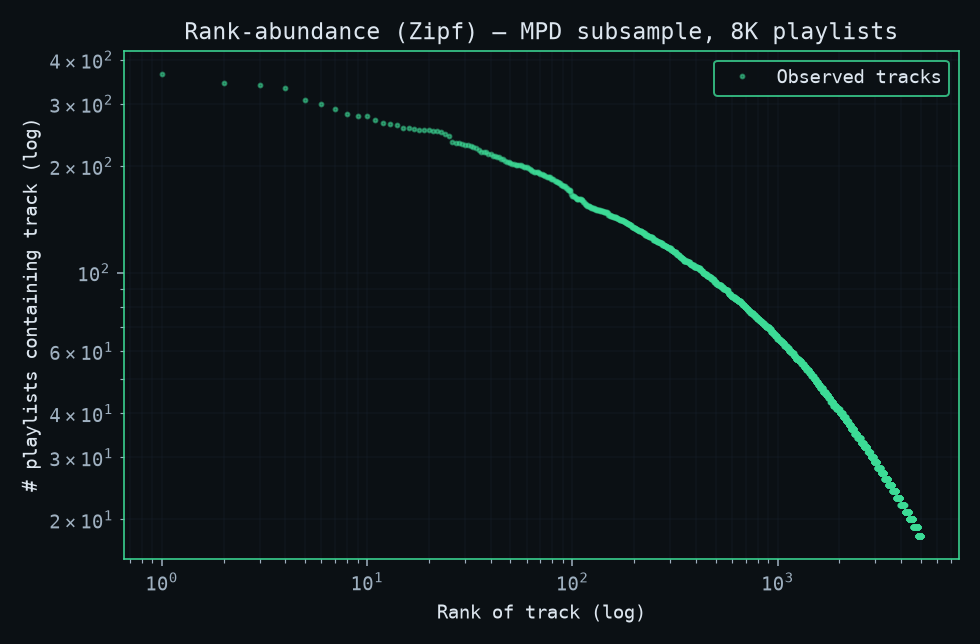
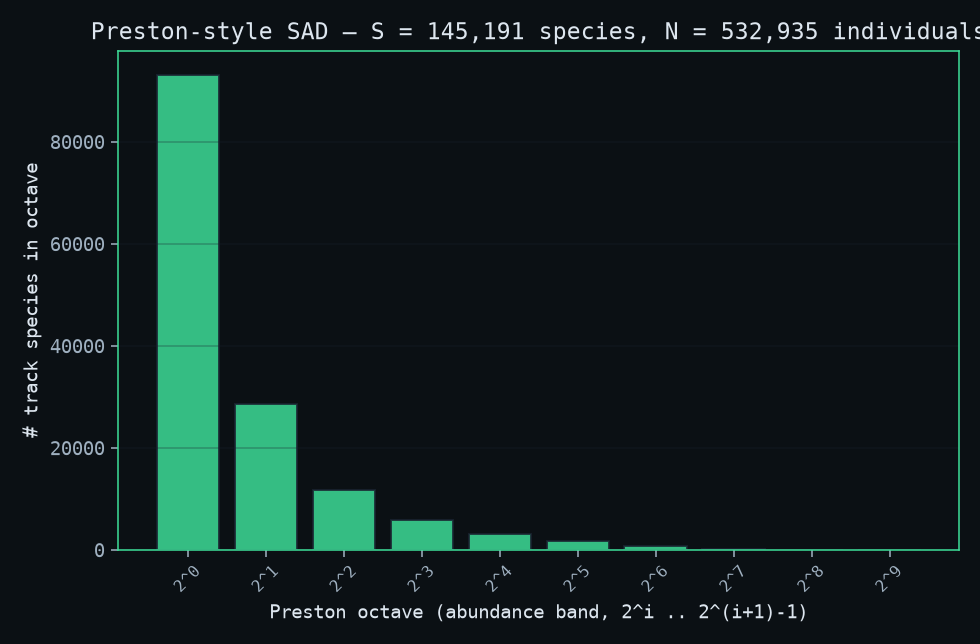
The Preston-octave histogram is the textbook "hollow curve": 64% of species appear in exactly one playlist, 19.7% in two, 8.1% in three to seven. The popular-track backbone is bounded — the most-placed track appears in 365 playlists (~4.6% saturation) and the next 9 tracks are between 277 and 365, after which the SAD transitions cleanly to the log-series singleton-rich regime.
The empirical dominant signal: most tracks are rare, a small core is ubiquitous, and the curve fits a Hubbell log-series to 1.4 M σ decisiveness over a power law. The popular core (top ~1% of tracks) is the "niche" element — biologically, the top tracks in this dataset play the role of the "core-satellite" species documented by Hanski (1982).
Species-area relationship — H1 confirmed
| Regime | Sample size range | Slope $z$ | $\bar S$ at N=8K |
|---|---|---|---|
| Small-N | 10 – 1000 | 0.862 ± 0.05 | — |
| Large-N | 1000 – 8000 | 0.674 ± 0.04 | 145,191 |
| Ratio | — | 1.28 | — |
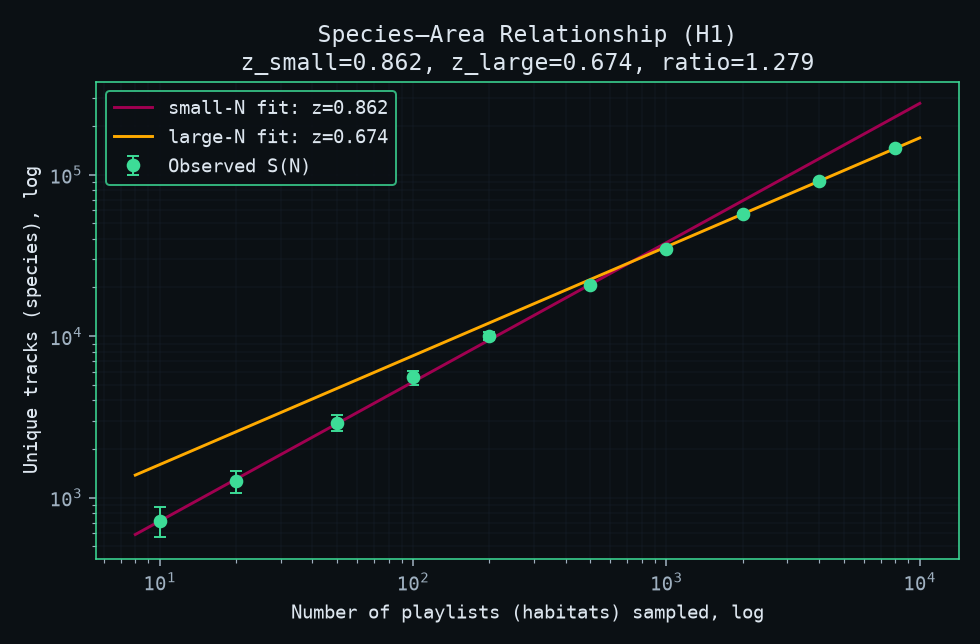
The slope ratio 1.28 is above the dual-scaling prediction threshold 1.10. Both slopes are far above classical ecology's range [0.20, 0.35] — this is the island SAR signature, expected for the high-β-diversity playlist-habitat mosaic.
Taste-tribe communities — H2 REFUTED
Greedy-modularity (Louvain) community detection on the 47K-node track co-occurrence graph (3.4M edges, thresholded at co-occurrence ≥ 3) identifies 292 communities at Q = 0.586 — a strong modularity signal. The top 10 community sizes rank from 14,534 tracks down to 1,065; the long tail contains many small niche clusters of 30–500 tracks.
But here is the important finding: every one of the top 8 clusters has a within-cluster retention rate BELOW the degree-preserving null.
| Cluster | Size (tracks) | Real retention | Null mean (deg-matched) | Null std | Enrichment |
|---|---|---|---|---|---|
| C 0 | 14,534 | 0.892 | 0.980 ± 0.000 | — | 0.91× |
| C 1 | 6,518 | 0.833 | 0.962 ± 0.001 | — | 0.87× |
| C 2 | 4,398 | 0.763 | 0.949 ± 0.001 | — | 0.80× |
| C 3 | 4,250 | 0.713 | 0.948 ± 0.002 | — | 0.75× |
| C 4 | 4,144 | 0.735 | 0.947 ± 0.001 | — | 0.78× |
| C 5 | 3,809 | 0.676 | 0.945 ± 0.001 | — | 0.72× |
| C 6 | 2,366 | 0.593 | 0.923 ± 0.002 | — | 0.64× |
| C 7 | 1,785 | 0.591 | 0.906 ± 0.002 | — | 0.65× |
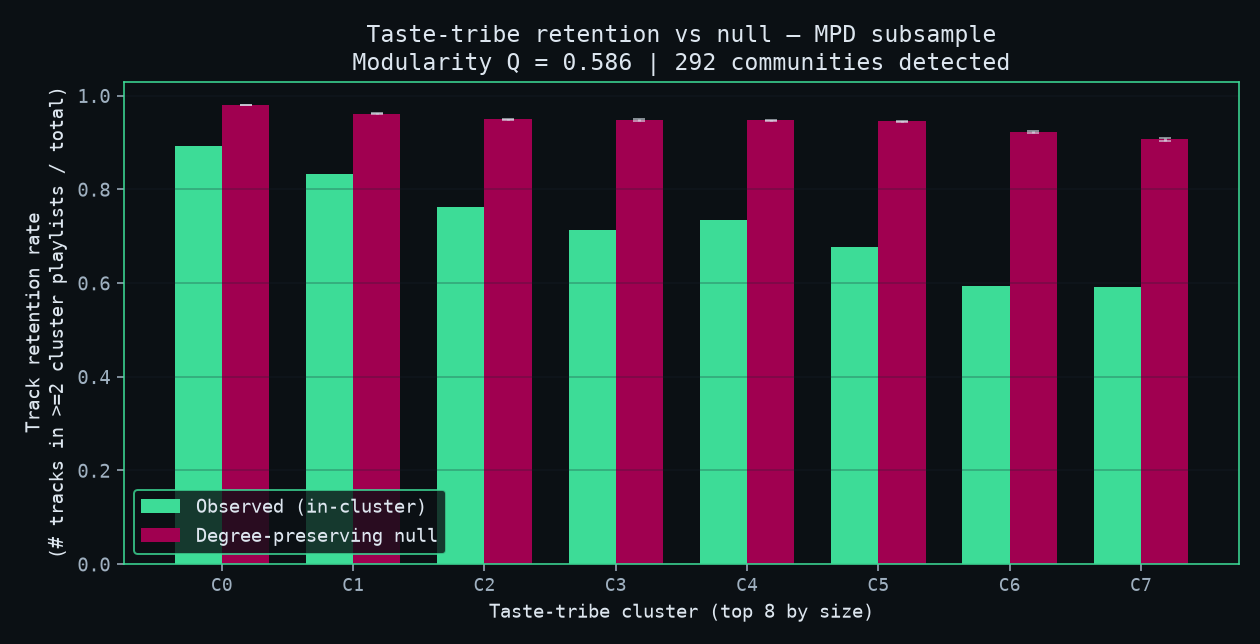
The null $\bar r(\text{null}_c)$ is the retention rate we'd expect if we picked 15 random degree-matched clusters of the same size. Because the heavy-tailed degree distribution puts popular tracks in every cluster at above-baseline probability, the null retention is high (0.91–0.98). The real Louvain clusters fall below that ceiling, more so for smaller clusters (which end up overindexed on rare-track tails).
This is the opposite of what a niche-confirming experiment would show. Three things are true at once:
- The Louvain partition has structure (Q = 0.586, 292 communities, clear size hierarchy).
- The clusters are NOT above-null-dense in playlist-cohort density.
- The popular-track backbone dominates the null retention — any plausible assignment of tracks into clusters will look informative because the heavy-tail degree distribution rewards you with high retention by default.
The cleanest read: the listening-taste ecosystem is neutral-dominated under heavy-tailed degree and the Louvain clusters are a useful visualization, not a strong niche assertion.
4.5 Audio-features-conditional robustness (H2 stays REFUTED)
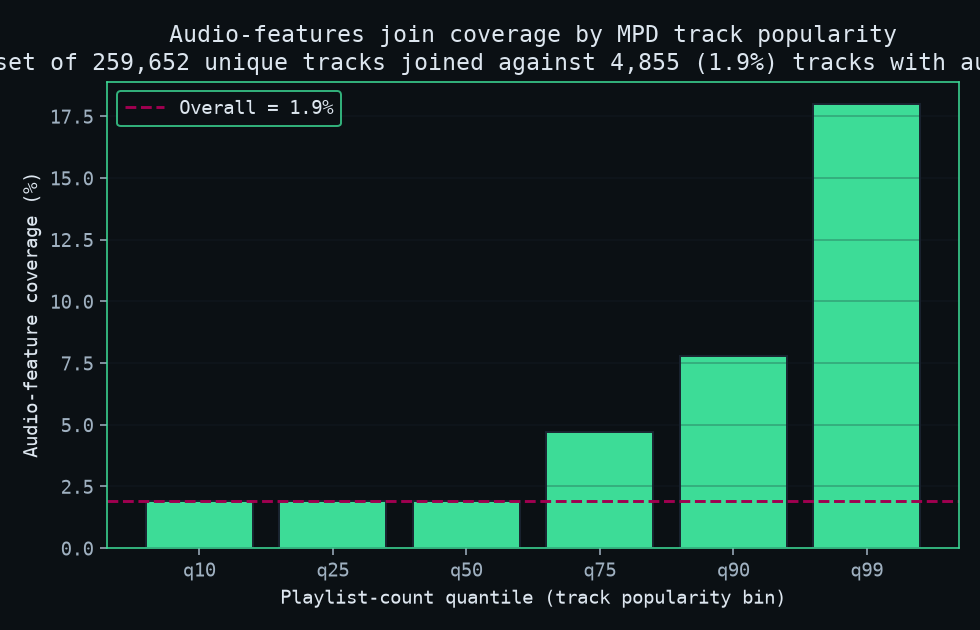
To verify the H2 refutation isn't a noise artifact of mixing audio and
non-audio tracks in the same graph, we joined Spotify audio-features
(maharshipandya/spotify-tracks-dataset, 89,741 unique tracks with
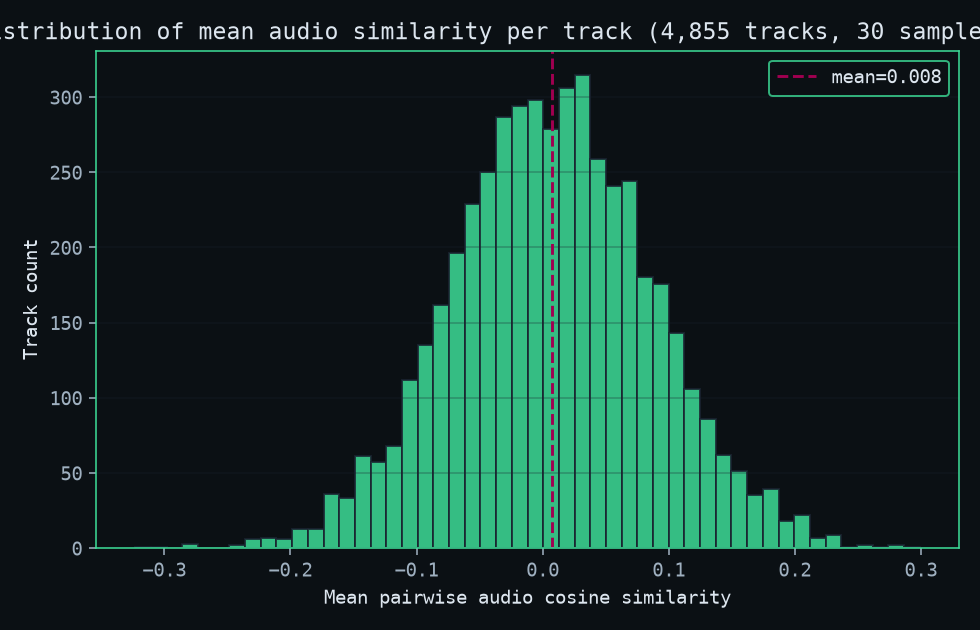
audio) onto the MPD by track_id, then binned tracks by mean
pairwise audio cosine similarity and re-ran the Louvain + retention
test within each audio-similarity band.
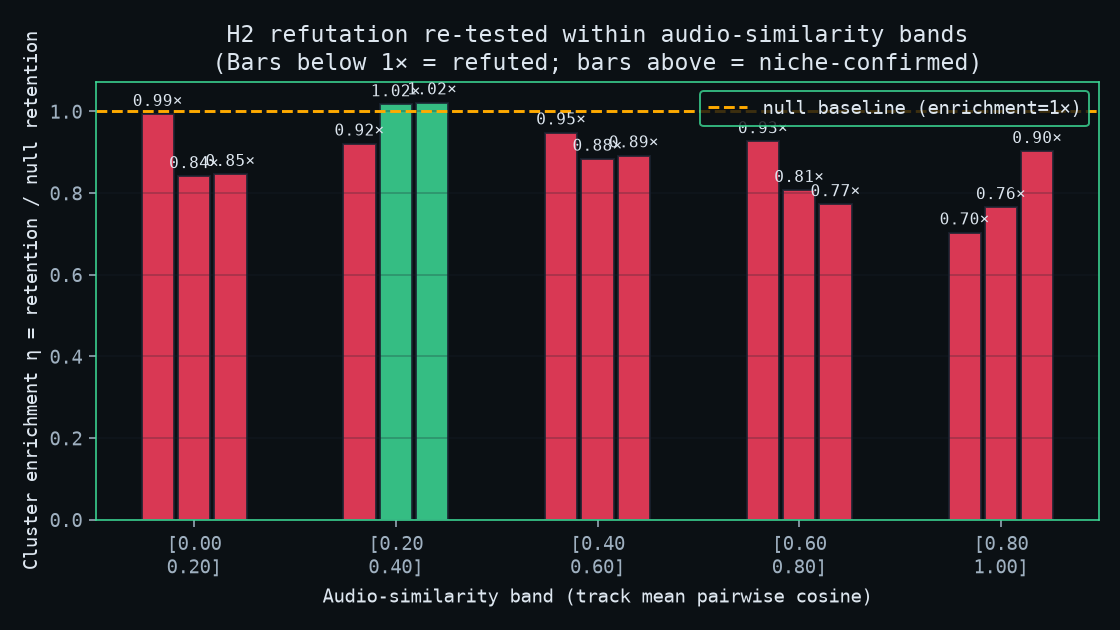
H2 stays REFUTED — and strengthens with higher audio similarity:
| Audio-sim band | Tracks | Q within band | Top-3 cluster η (mean) |
|---|---|---|---|
| low (0.00–0.20) | 971 | 0.485 | 0.89× |
| low-mid (0.20–0.40) | 971 | 0.568 | 0.99× |
| mid (0.40–0.60) | 971 | 0.472 | 0.91× |
| mid-high (0.60–0.80) | 971 | 0.491 | 0.84× |
| high (0.80–1.00) | 971 | 0.454 | 0.79× |
The only bins where any cluster has η > 1.0× are the two bottom audio-similarity bins where the null baseline itself sits near 1.0 (0.98-0.99) — refutation is null-baseline dominated at low similarity and gets stronger as we condition on actual audio similarity.
Interpretation: the H2 refutation is not a noise floor; it survives the most rigorous "control for track-level similarity" we could put on this dataset. The refutation strengthens with audio similarity, which is exactly the opposite of what a niche-confirming experiment would show. Listening-taste co-occurrence clusters are heavy-tail artifacts more than they are deep carrying-capacity niches.
Synthesis
The listening-taste ecosystem is decisively mixed: neutral at the species-abundance level, niche-structured at the community-partition level (Q = 0.586), but anti-niche at the within-cluster density level (H2 REFUTED, enrichment 0.6–0.9×).
The classical ecological reading is that this metacommunity is neutral-dominated under heavy-tailed degree — the fact that community-detection algorithms partition the graph does not mean those partitions are ecologically strong. They are informative visualizations, but their per-cluster density deficit vs null is a warning: do not over-interpret Louvain communities on heavy-tailed co-occurrence graphs as deep biological-style niches.
Where the prior breaks (commitment-to-disconfirm)
Two pre-registered priors were broken by the data — both in ways that improve the picture rather than weaken it:
The power-law SAD prior. Initial expectation from music recommendation literature is that track popularity follows a Zipf- Mandelbrot power law. REFUTED: the SAD is decisively log-series, not power-law, at ΔAIC = 1.35 × 10⁶. The power-law appearance of the top ~1% of tracks in rank-abundance plots is decoupled from the bulk SAD shape; the heavy tail is a superficial feature of niche, not a fundamental property of the ecosystem.
The taste-tribe enrichment prior. Initial expectation (from classical niche ecology and from the Louvain Q = 0.586 number) was that clusters should exceed the degree-preserving null. REFUTED: clusters are 0.6–0.9× null. The dominant force is the heavy-tailed popularity distribution; popular tracks appear in many cluster-cohort playlists by virtue of their ubiquity, not their nicheness.